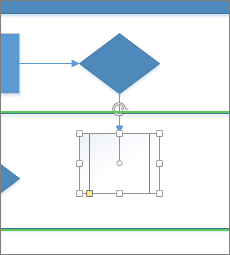
Microsoft Visio is a robust concept tool for businesses that a few people know and few know how to use it. Every business can communicate data-driven information clearly in a visually appealing way.
Visio is a highly effective software application with its cloud-based solution, users can diagram most anything – from information technology topographies to organizational charts and much more.
A solid collaboration is essential because of our new normal economy, and Visio helps visualize every business knowledgeable and insightfully.
Please take a look at Microsoft Visio’s features and functions and how it improves modern businesses nowadays.
What is Microsoft Visio?
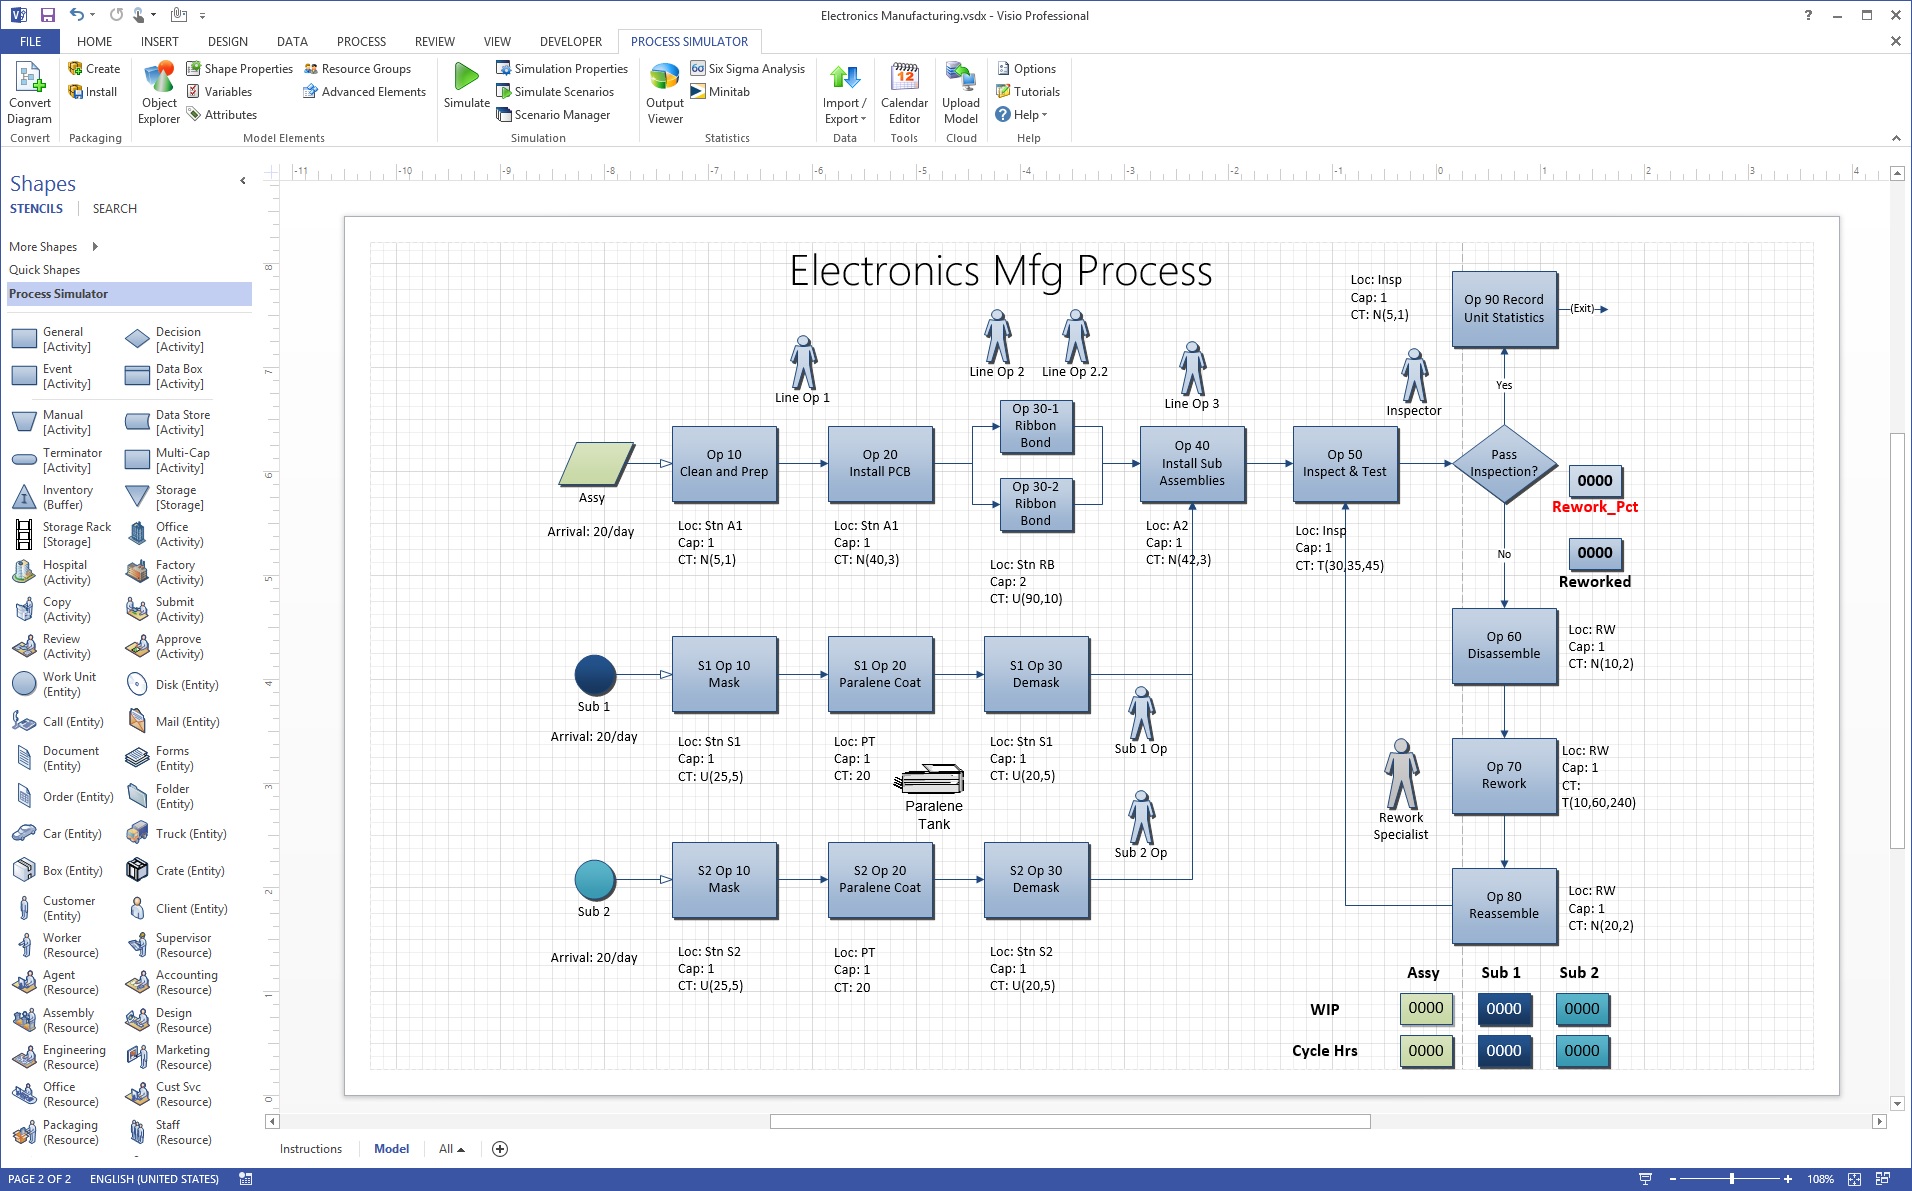
Microsoft Visio is a versatile diagramming and vector graphics that help you create a professional diagram. It can create an organizational chart, maps, workflows, and home or office plans using a set of shapes and templates. It is part of the Microsoft Office family but has never been included in primary Office 365 packages.
This application is easy to use and creates highly effective visual diagrams that port into Powerpoint and Publisher applications.
Microsoft Visio is one of the Microsoft digital products that efficiently and effectively adds productivity to businesses.
Visio Standard vs. Professional
The main difference we know between standard and professional editions is the drawing you can develop, and the two editions come with models to help you get started.
Microsoft Visio Standard
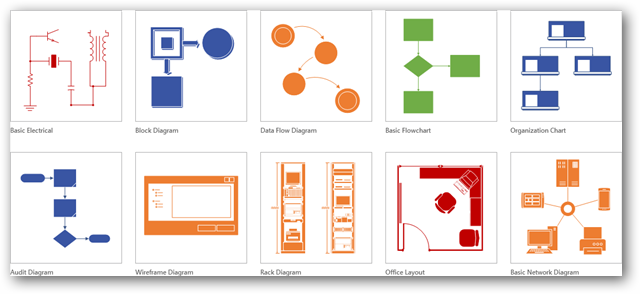
Visio Standard is designed to work with simple business diagrams, organizational maps, basic flowcharts, and versatile drawings. Templates are included for simple diagrams, not for more drawing types and drawing named in the next paragraph.
It offers the ability to make professional and compelling diagrams with a range of new and updated tools. Users can easily change the shapes on existing charts without losing the layout. By this, it makes it easier to change the design of your diagrams without losing the work.
Microsoft Visio Professional 
Visio Professional is designed to create advanced drawings. Like engineering schematics, advanced process diagrams, floor plans, software mapping, and database modeling. Users can identify the data source, import and link the data to shapes, and apply their desire data graphics. It quickly changes diagrams to dashboards and monitors performance in real-time.
What are the features?
Microsoft Visio 2016 came with several new features that improve upon an already useful application.
Take a look at five new features in Visio that help you:
- Visio 2016 comes with a collection of starter templates with prompts to get users to go. These starters come with contextual suggestions for the fifteen most used diagram types.
- Visio comes with the Tell Me feature that uses hundreds of commands. Users can get a list of ways to execute the tasks and anything from the drop-down list.
- Microsoft has developed many shapes that meet UML 2.4, IEEE, and BPMN 2.0 specifications.
- Easy Import capabilities add real-life diagrams to the excellent data link framework with a one-step data link. The conversion of data is quick, making it very easy in Visio to connect shapes and graphics.
- Protects confidential info and provides individual user-level document rights to ensure collaborative functionality.
How Visio Use
Visio can create excellent diagrams in several ways. Hand-drawn diagrams may suit the needs, or in MS Word, they may turn to the basic diagram functions. Lucidchart is good choice if you want free and less costly, and it works on Mac.
Visio consists of a large library of shapes that are used by dozens of diagram types. These help you with the professional look you want for presentations, surveys, audits, design plans, floor plans, and more. Here are a few examples:
In any field
- Flowcharts can be used to record programs and evaluate them. It standardizes the process for consistency and accuracy, and all parts of the organization know the process. It determines the improvement of bottlenecks, redundancies, and redundant process steps.
In software engineering and business analysis
- Data flow diagrams (DFDs) offers an oriented approach to technical development in which research is done to get coding. Business analysts use DFDs to evaluate existing processes to find efficiencies. Diagramming will uncover steps that might be disregard or not fully understand.
In business
- Business Process Modeling and Notation (BPMN) explains the processes through a comprehensive representation of the participants and stakeholders.
In chemical engineering or process engineering:
- Process Flow Diagram (PFD) displays the relationship between the key components of the industrial plant. Diagrams may serve as a simpler means of tracking, assessing, auditing or modeling.
Visio file formats
As of 2013, Visio uses VSDX and VSDM file formats based on the Open Packaging Convention standard. They consist of a collection of XML files within a Zip file. The only difference between these two types is that VSDM files may have macros.
Microsoft Visio for Beginners
Visio allows users to customize text and tables into visual diagrams. It conveys information at a glance. Organizational charts, network diagrams, workflows, and office schedules are several types of diagrams.
Visio can summarize three simple steps: using a template, organizing, connecting shapes, and modifying them.
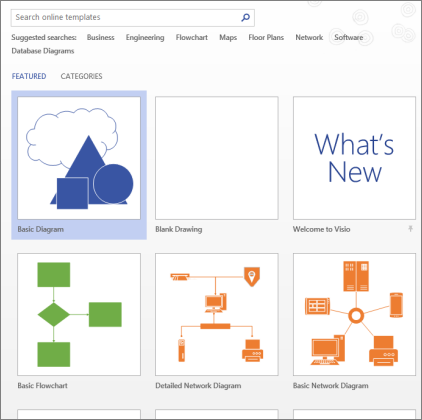
Choose and open a template
Templates include stencils, shapes, and grid measurements to help you start quickly and effectively as you make your diagram.
- Open Visio on the web, then select File > New.
- Select the Basic Diagram to start. For more templates, select Categories, and search for templates by entering terms.
3. If you are using the desktop link, identify a specific type of that template and select Create.
Arrange and connect shapes
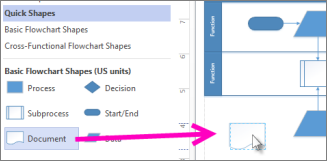
To create a diagram and connect them, drag shapes from the stencil in the Shapes window onto the canvas. There are several ways of connecting shapes, and the simplest method is to use the AutoConnect arrow.
Select a shape in the Shapes window and drag it onto your canvas.
Keep your mouse over the arrows, and the mini toolbar appears n the Quick Shapes area.
Choose the shape you want and automatically connect to the arrow you selected. Keep the mouse, grab the arrow and remove it to the shape you want.
Move the new outline directly from the Shapes window to the current shape arrows and automatically connect them.
Add text to shapes and connectors
- Select a shape.
- Type your text. (When typing, it switches the selected shape into a text-editing mode.)
- Click on the empty area of the page, or press Esc.
- To move text on a shape, go to Home > Tools > Text Block, and go to a shape that has text. Drag the text and go back, then click Home > Tools > Pointer Tool when you are done.
- Add text to the connector. After you click ESC, click the connector again, next, you can see a little box reader. Please select it and drag it up, and click down, or next to the connector.
Conclusion: Microsoft Visio in Every Business
Many businesses can save time and speed up their operations, and Microsoft Visio is a valuable tool that can be used in various ways. To help your company expand, you need to start focusing on mapping business processes and working efficiently and consistently.
Search for an alternative Visio that suits your business needs. Going down the broad path can increase costs in terms of time and effort. With Visio, every organization allows to learn and understand transparency processes for their businesses.

